
Datei:Carbon cycle-cute diagram-german.svg

Größe der PNG-Vorschau dieser SVG-Datei: 540 × 417 Pixel. Weitere Auflösungen: 311 × 240 Pixel | 622 × 480 Pixel | 995 × 768 Pixel | 1.280 × 988 Pixel | 2.560 × 1.977 Pixel.
Originaldatei (SVG-Datei, Basisgröße: 540 × 417 Pixel, Dateigröße: 249 KB)
| Diese Datei und die Informationen unter dem roten Trennstrich werden aus dem zentralen Medienarchiv Commons eingebunden. Weitere Informationen und eine Kontaktmöglichkeit zum Urheber sind dort zu finden. |
Zur Beschreibungsseite auf Commons |
| Beschreibung |
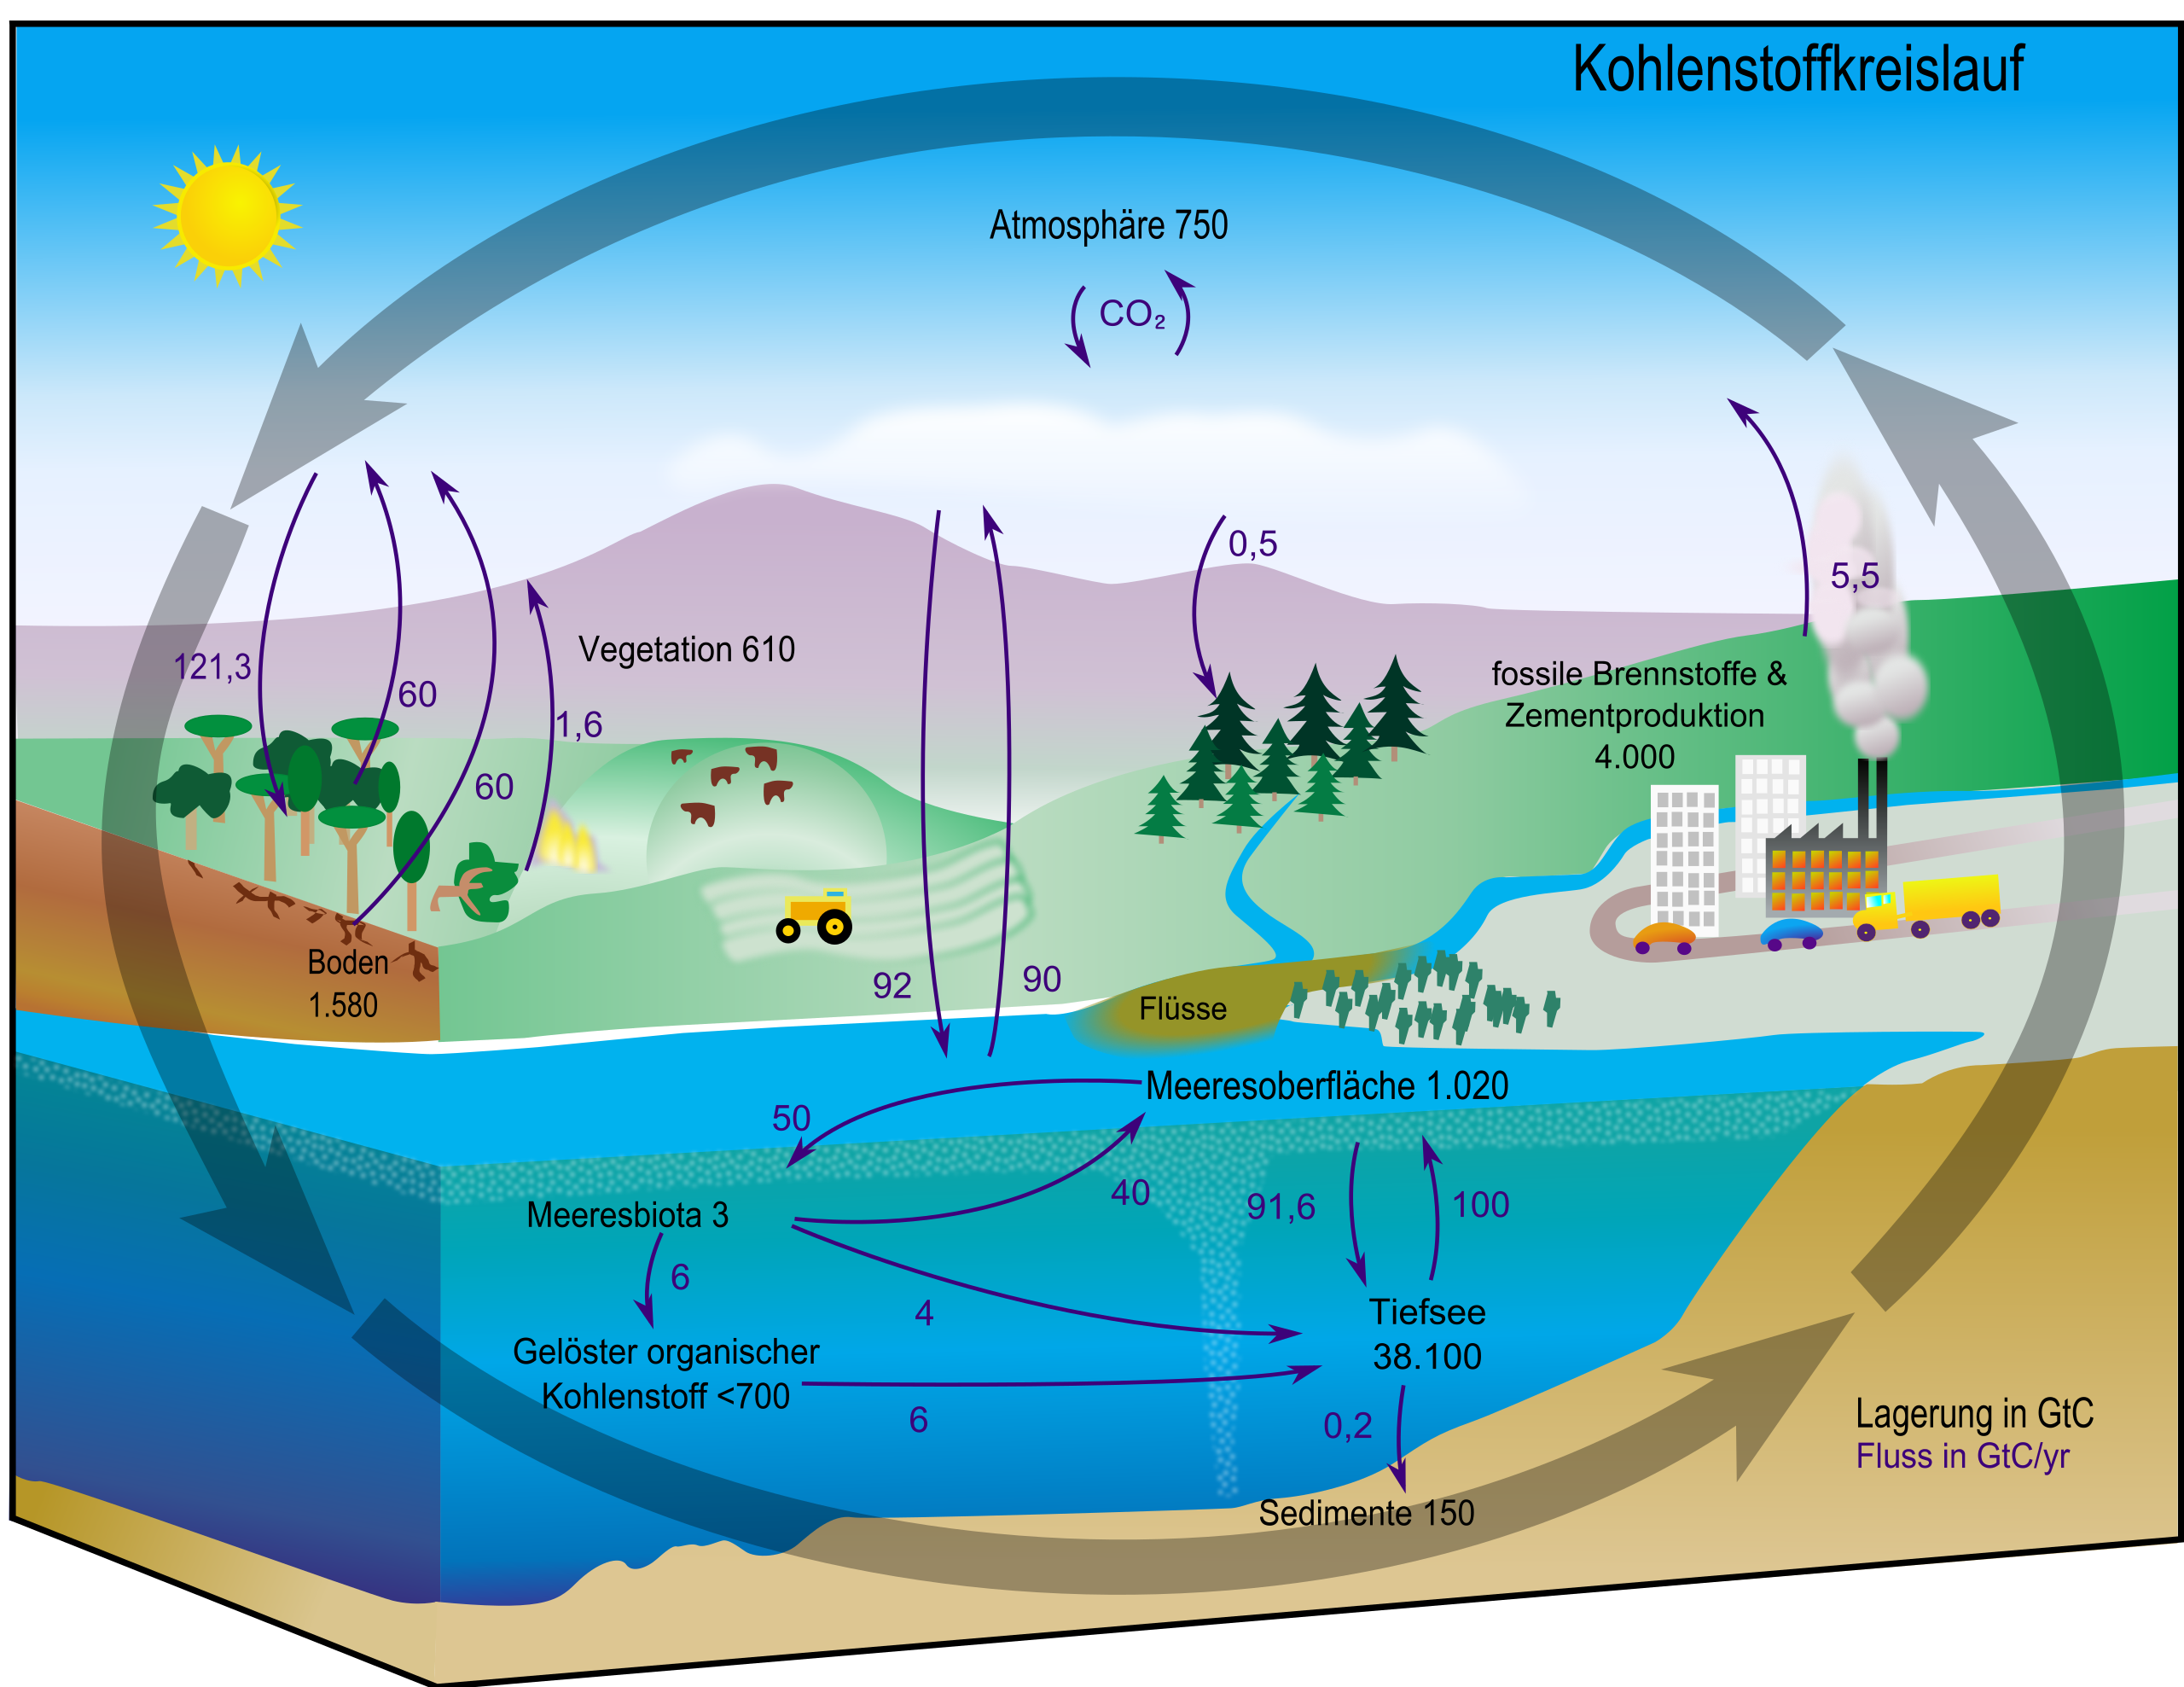
English: This carbon cycle diagram shows the storage and annual exchange of carbon between the atmosphere, hydrosphere and geosphere in gigatons - or billions of tons - of Carbon (GtC). Burning fossil fuels by people adds about 5.5 GtC of carbon per year into the atmosphere.
Deutsch: Diagramm des Kohlenstoffkreislaufes. Die schwarzen Zahlen zeigen wie viele Milliarden Tonnen Kohlenstoff (Gt C) in den verschiedenen Reservoiren vorhanden sind. Die blauen Zahlen zeigen an, wie viel Kohlenstoff zwischen den einzelnen Speichern pro Jahr ausgetauscht wird.
Español: Este esquema del ciclo del carbono muestra el almacenamiento y los cambios anuales del carbono entre la atmósfera, la hidrósfera y la geósfera en gigatones, o billones de toneladas, de carbono (GtC). La quema de conustibles fósiles libera cerca de 5.5 billones de toneladas de carbono al año en la atmósfera.
日本語: 炭素循環の概念図。黒の数値はそれぞれのリザーバーに存在する炭素量、青の数値はリザーバー間での年間の炭素の移動量。単位はギガt(10億トン)
Русский: Схема геохимического цикла углерода показывает количество углерода в атмосфере, гидросфере, и геосфере Земли, а также годовой перенос углерода между ними. Все величины в гигатоннах (миллиардах тонн). В результате сжигания ископаемого топлива, человечество ежегодно добавляет 5,5 гигатонн углерода в атмосферу. |
| Datum | (UTC) |
| Quelle | |
| Urheber |
|
| Andere Versionen |
[] Single-language versions
|


| Dieses Bild wurde digital nachbearbeitet. Folgende Änderungen wurden vorgenommen: version in german. Das Originalbild kann hier eingesehen werden: Carbon cycle-cute diagram.jpeg:
|
| Ich, der Urheberrechtsinhaber dieses Werkes, veröffentliche es als gemeinfrei. Dies gilt weltweit. In manchen Staaten könnte dies rechtlich nicht möglich sein. Sofern dies der Fall ist: Ich gewähre jedem das bedingungslose Recht, dieses Werk für jedweden Zweck zu nutzen, es sei denn, Bedingungen sind gesetzlich erforderlich. |
Ursprüngliches Datei-Logbuch
This image is a derivative work of the following images:
- Image:Carbon_cycle-cute_diagram.svg licensed with PD-self
- 2008-06-01T02:20:22Z FischX 540x417 (154403 Bytes) {{Information |Description= |Source= |Date= |Author= |Permission= |other_versions= }}
- 2008-05-30T02:17:27Z FischX 540x417 (125503 Bytes) {{Information |Description= |Source= |Date= |Author= |Permission= |other_versions= }}
- 2008-05-30T02:03:21Z FischX 540x417 (126458 Bytes) {{Information |Description={{en|This [[:en:carbon cycle|carbon cycle]] diagram shows the storage and annual exchange of carbon between the [[:en:Earth's atmosphere|atmosphere]], [[:en:hydrosphere|hydrosphere]] and [[:en:geosp
- Image:Carbon_cycle-cute_diagram.jpeg licensed with PD-USGov-NASA, PD-USGov-NASA/copyright
- 2006-09-12T15:16:24Z Giac83 540x417 (53453 Bytes) {{Information| |Description= This [[:en:carbon cycle]] diagram shows the storage and yearly changes of the carbon between the [[:en:Earth's atmosphere|atmosphere]], [[:en:hydrosphere]] and [[:en:geosphere]] in Gigatons - or b
Hochgeladen mit derivativeFX
Dateiversionen
Klicke auf einen Zeitpunkt, um diese Version zu laden.
| Version vom | Vorschaubild | Maße | Benutzer | Kommentar | |
|---|---|---|---|---|---|
| aktuell | 18:42, 27. Jun. 2011 | | 540 × 417 (249 KB) | Yikrazuul | minor fixes |
| 20:59, 14. Okt. 2008 |  | 540 × 417 (161 KB) | FischX | {{Information |Description= |Source= |Date= |Author= |Permission= |other_versions= }} | |
| 03:24, 12. Jun. 2008 |  | 540 × 417 (161 KB) | FischX | Reverted to version as of 01:17, 12 June 2008 | |
| 03:24, 12. Jun. 2008 |  | 540 × 417 (151 KB) | FischX | Reverted to version as of 21:53, 2 June 2008 | |
| 03:17, 12. Jun. 2008 |  | 540 × 417 (161 KB) | FischX | {{Information |Description= |Source= |Date= |Author= |Permission= |other_versions= }} | |
| 23:53, 2. Jun. 2008 |  | 540 × 417 (151 KB) | FischX | {{Information |Description= |Source= |Date= |Author= |Permission= |other_versions= }} | |
| 23:46, 2. Jun. 2008 |  | 540 × 417 (151 KB) | FischX | {{Information |Description={{en|This carbon cycle diagram shows the storage and annual exchange of carbon between the atmosphere, hydrosphere and geosphere in gigatons - |
Dateiverwendung
Die folgende Seite verwendet diese Datei:
Globale Dateiverwendung
Die nachfolgenden anderen Wikis verwenden diese Datei:
- Verwendung auf de.wikipedia.org
- Verwendung auf it.wikipedia.org